
TOP FACTS
FOOD & ECONOMICS
Here is a list of what we consider the most credible figures and statistics to use based on the entire body of evidence in our database. This list will be updated over time as new evidence emerges.
Think we should update this or do you have a different interpretation than us? Please contact us directly, we're always open to discussing the evidence:
FOOD SYSTEM TRANSFORMATION
The Food Systems Economic Commission (FSEC) estimates that the total hidden costs of the burdens current food systems place on people and the planet are estimated at $15 trillion annually, equivalent to 12% of global GDP in 2020:
-
Health costs - $11 trillion/year
-
Environmental costs - $3 trillion/year
-
Structural poverty - $1 trillion/year
The UN Food and Agricultural Organization (FAO), meanwhile, estimates that the hidden costs of the food systems for 154 countries amounted to $12.7 trillion dollars in 2020, of which more than $9 trillion (or 73%) were due to health-related costs predominantly driven by unhealthy dietary patterns that lead to non-communicable (aka chronic) diseases (NCDs). Major dietary risk factors include low intake of whole grains, high sodium consumption, and low fruit intake.
Meanwhile, the net benefits of transforming the food system - through reducing hidden costs and shifting diets in high-income areas towards diets more in line with EAT-lancet guidelines - are worth $5-10 trillion USD a year, equivalent to between 4 and 8% of global GDP in 2020 (Laderchi et al. 2024).
A dietary shift away from animal-sourced foods could save $7.3 trillion worth of production-related health burden and ecosystem degradation while cutting carbon emissions (Lucas et al., 2023).
Investment in plant-based proteins has the highest emissions impact per dollar of invested capital of any sector. Using an estimated emissions value of $50 to $80 per ton of CO2e, if plant-based proteins could replace the total addressable market, the impact return on capital employed ($221-$354 billion per trillion dollars of invested capital) is at least three times greater than anything that corresponding abatement investments in other high-emitting sectors of the economy can achieve (Morach et al, 2022).


EXTERNALITIES
Global external health costs (unhealthy diet, obesity, undernutrition, antimicrobial resistance, zoonoses) and environmental costs (emissions, soil depletion, water use and air, water and soil pollution) of food systems may be ~two times larger than food valued at market prices: ~$20 trillion of externalities versus $9 trillion of food value in the markets (Braun & Hendrichs, 2023).
Globally, approximately US$2 of production-related external costs were embedded in every dollar of food expenditure in 2018 - corresponding to US$14 trillion of externalities (Lucas et al., 2023)
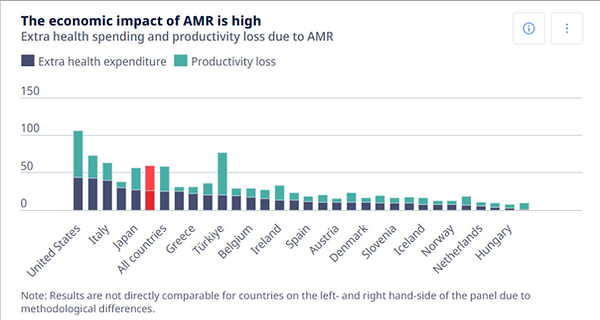
Antibiotic Resistance (AMR)
AMR is primarily driven by inappropriate use of antimicrobials, including antibiotics, in human health, agriculture and livestock production and by contamination of the environment. An estimated 65-70% of total antibiotics globally are used in animal agriculture. Some regions use up to 80% of their total antibiotics for livestock instead of human medicine (World Organization for Animal Health, 2024). In the United States, about 65% of medically important antibiotics are used in food animals (CDC 2023).
In some countries such as Greece, India and Türkiye, more than 40% of all infections caused by the 12 antibiotic-superbug combinations that OECD studied are expected to be resistant to antibiotics by 2035.
Source: (World Organization for Animal Health, 2024)
AMR leads to over 1.1 million direct deaths annually, and almost five million associated deaths. Almost as many people die from AMR than from HIV/AIDS, malaria, tuberculosis and pneumonia combined (GBD Antimicrobial Resistance Collaborators 2024). Without intervention, AMR could cause 10 million deaths per year by 2050, a total greater than deaths from cancer today (Interagency Coordination Group on Antimicrobial Resistance, 2019).
The costs of AMR are massive: up to US$ 3.4 trillion in GDP losses per year by 2030 (Olga, J. et al., 2017) and up to $1 trillion in additional healthcare costs by 2050. Healthcare costs for resistant infections are up to 10x higher than for non-resistant infections (OECD Health Policy Studies 2023)
Innes et al. (2019) focus specifically on the health costs associated with antimicrobial resistance (AMR), estimating an externality cost of $1,500 per kg of enrofloxacin used in broiler chicken production.
Tackling AMR saves lives and yields economic benefits. For every US$ 1 invested in a mixed policy intervention package, a global net return of between US$ 7.2 and US$ 13.1 is expected
Some estimates calculate that a multi-prong approach to tackle AMR - improving awareness and surveillance; investing in new drugs, tools and interventions; effective infection prevention measures, and optimizing antibiotic use in human and animal health - could save ~US$ 4.4 trillion by 2035 in healthcare costs alone and ~US$ 9.1 trillion by 2050 in total financial gains from workforce participation.
Healthcare systems are expected to spend up to around US$ 412 billion per year between 2015 and 2035 due to AMR (Global Leaders Group on Antimicrobial Resistance, 2024).
Source: (Global Leaders Group on Antimicrobial Resistance, 2024)
Diseases
For well over a decade, the emergence and rise of zoonotic diseases has been linked to
agricultural intensification and environmental change (Jones et al., 2013).
Since 2009, the direct cost of zoonotic diseases has been estimated at more than $20 billion and indirect losses at over $200 billion (Barratt et al. 2019). Indirect costs from these diseases can be much higher.
Total costs of infectious diseases within the livestock sector (including control strategies involve biosecurity, vaccination, sanitation, diagnosis, antibiotics, antiviral medicines, anthelmintic drugs, and culling) have been estimated at up to 20% of turnover in developed countries and as high as 35-50% of turnover in the developing world. (Pal, A & Chakrapaty, A 2022)
Over 20% of global animal production losses are caused by animal diseases, with a value of approximately US$300 billion. Karmacharya, (D 2024)
In sub-Saharan Africa, endemic diseases are estimated to cause annual losses of US$4 billion, or 25% of the total value of livestock production. (Countryman, A. et al. 2024))
The outbreak of African Swine Fever in 2019 led to the slaughter of over 200 million pigs in China, ~30% of their pig population, with estimates of the total economic loss at ~US$111.2 billion. (You et al., 2021). Global pork prices were estimated to increase by 17-85%.
Annual losses from mastitis in the dairy industry - the costliest disease in the dairy industry -
are ~$2.0 billion in the U.S. and India ~Rs. 6053.21 crore per year. Total economic losses to U.S. dairy farmers have been estimated at $400 to $500 million, or anywhere from $23 - $150 per cow. (Pal, A & Chakrapaty, A 2022)
Every year, up to 40% of global crop production is lost due to plant pests and diseases, costing the global economy over USD $220 billion. (FAO 2022)
Environmental Externalities
The estimated economic losses due to illegal logging, fishing, and wildlife trade are $1 trillion–$2 trillion per year—with more than 90% of these losses from ecosystem services that are not currently priced by the market (World Bank 2019).
In 2019 the beef industry in Brazil (including retail and associated sectors) contributed 8.5% of the country’s GDP but was linked to 90% of deforestation in the Amazon, causing losses equivalent to 15% of the country’s $285 billion GDP. (Figaredo & Chatsuwan, 2022)


MARKET SIZE
(Note: market size estimates can vary substantially, depending on how they’re calculated)
Agriculture
The global agriculture market grew to ~$13.4 trillion in 2023 and expected to grow annually at 9.1% to $19 trillion in 2027. This market includes more than food products (e.g. by-products like leather and other products like tobacco and services like forestry & logging)
(Reportlinker's Agricultural Products Market Outlook 2022-26)
The global food market is expected to reach $9.7 trillion and grow annually at ~6.4% annually until 2030.
-
The market's largest segment is meat with a market volume of US$1.55tn in 2025.
Farmed Animals
The global market value of farmed animals (meat, dairy, eggs, aquaculture) varies significantly based on which part of the supply chain you measure, but estimates suggest it ranges from $1.6 - $3.3 trillion USD. Livestock markets are very large, but the animal feed industry (~$500B in 2023) and other associated industries (like leather and wool) are also significant contributors.
The global animal feed market - which includes feed for livestock (cattle, poultry, swine), aquaculture, and pet food - was estimated at $500 billion USD in 2023 and forecasted to grow to $617 billion by 2030 (CAGR 3-4%), driven by increased livestock production, growing aquaculture industries, and advances in feed additives. Poultry and swine feed tend to dominate the market. (Cognitive Market Research, 2024)
The global beef market was estimated at $446 billion USD in 2023 and expected to grow to ~$646 billion by 2033 (CAGR 4.5%), driven by increasing demand in emerging markets. (Customer Market Insights, 2024)
The global chicken market was estimated at ~$152 billion USD in 2023 and expected to reach $253 billion by 2032 (CAGR 5.84%). Chicken is the most consumed meat globally, and demand is expected to continue rising, especially as it is seen as a more affordable protein source in lower and middle-income regions. (Research and Markets, 2024)
The global pork market was estimated at ~$250 billion in 2023 and is expected to reach $352 billion by 2032 (CAGR 3.9%). Pork is one of the most widely consumed meats, especially in Asia, but its growth rate is slightly slower compared to poultry due to dietary shifts and competition from other protein sources. (Research and Markets, 2024)
The global seafood market was estimated at ~$163 billion USD in 2023, and could reach $210 billion USD by 2030 (CAGR 3-4%), depending on factors like aquaculture growth, sustainable fishing practices, and consumer demand for healthier proteins. The growth is largely driven by increasing demand for fish and shellfish (particularly in Asia), expanding aquaculture practices and growing consumer interest in seafood as an alternative to red meat. (Precedence Research, 2024)
The global insect-based protein market was valued at around $3.3-4 billion USD in 2023 and expected to reach over $10 billion USD by 2027 (CAGR 25-27%), making it one of the fastest-growing protein sectors.
Wild Animals
The global wild animal market could be valued at anywhere between $400-600 billion USD:
-
Wild-caught seafood market was estimated at $100-150 billion (FAO, 2022).
-
Legal wildlife trade market (e.g. hunting, fur, exotic pets) is estimated to be worth around $300-400 billion USD annually (UNEP, 2020)
-
Illegal wildlife trade market (includes illegal poaching and trafficking of animals and illegal trade in exotic pets) is estimated to generate between $7-23 billion USD per year, making it one of the most lucrative illicit markets in the world (Interpol 2020)
Plant-Based
The global plant-based food market was valued at $43.8 billion USD in 2023, projected to reach $85 billion USD by 2030 (CAGR ~10%). The PB meat market is segmented into soy, wheat, and pea - soy-based meat segment dominated the market in 2021, accounting for more than 46.2% of global revenue. (Market Digits, 2024)
The plant-based alternative protein market (plant-based, cultivated & fermentation-derived proteins) was valued at $10.3 billion in 2023 and predicted to reach $28 billion by 2025 (CAGR 8-12%) (Grand Views Research 2023). Breaking down this estimate by segment:
-
The strictly plant-based protein segment - i.e. products made from soy, pea, wheat, and other plant sources - is the largest segment, valued at around $7 billion USD in 2023 and projected to grow up to $100-165 billion by 2050 (if 8-12% CAGR is maintained).
-
The cultivated meat market was estimated to be worth just USD $200 million in 2024, but is expected to reach $2-3 billion USD by 2030 and $229 billion USD by 2050 (CAGR of 50%) (Roots Analysis 2024).
-
The precision fermentation market, valued at $2.1 billion USD in 2023 and is projected to reach $57 billion USD by 2032, (CAGR of 44.3%) as new applications for fermentation technology emerge. Europe dominated the precision fermentation market in 2023 (market share of 49.5%) (Fortune Business Insights, 2024)
Alternative meat sales currently represent 1% of the world market for meat, but this could grow to 10% by 2030 (IPES 2024). While currently Europe holds the biggest market share, at 38.5% of global revenues in meat substitutes, the Asia-pacific market is projected to grow the fastest, at 11.18% per year to 2028.
Leading consultancies and data providers forecast a range of potential market growth for alternative proteins. AT Kearney and Statista report that alt-proteins could have a long-term global meat market penetration of 60% in a best-case scenario, for example, which could generate $1.1 trillion in annual sales by 2040. Even in its lowest growth model, Credit Suisse forecasts that alternative proteins could account for at least 25% of the market by 2050, with a value of $555 billion (Figaredo et al., 2022).
The global plant-based milk market was valued at $16.5 billion USD in 2023 and projected to hit $35.4 billion by 2032 (CAGR 5.9%), driven largely by increasing lactose intolerance among consumers and growing demand for sustainable and healthier milk alternatives. (Business Research Insights, 2023). Milk- and dairy-alternatives per capita sales were almost double in the US compared to the EU (Vallone & Lambin, 2023)
The global plant-based cheese market was valued at ~$2.4 billion USD in 2023 and projected to reach $7.1 billion USD by 2032, (CAGR 12.6%) from 2023 to 2032 (Allied Market Research, 2024)
Plant-based cheese accounts for only 4% of all cheese types launched globally in 2021, but, according to market research from Mintel, it represents 27% of new processed cheese launches. Younger consumers will drive demand for vegan cheese consumption. In Brazil, 49% of Gen Z and 50% of Millennials say they are interested in plant-based cheese.
The Middle East and Africa plant-based protein markets, which import ~45% of their total PB proteins from North America and Europe, is expected to reach USD 22.02 billion by 2030, growing at a CAGR of 4.95% from 2024. Soy and pea protein are playing crucial roles in this growth. Virtue Market Research (2024)

POWER CONCENTRATION
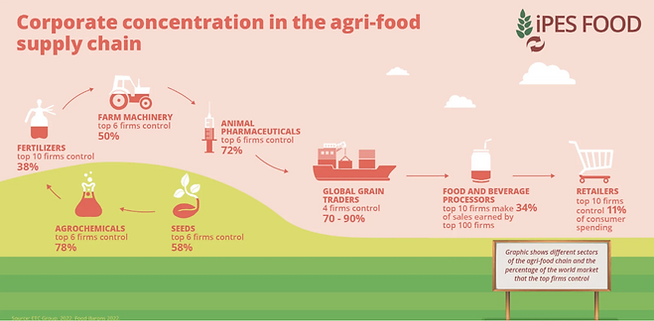
Vertical integration of supply chains, both within the U.S. and globally, means that decisions and profits become concentrated in the hands of just a few corporations, while farmers and farmworkers take on the risks with very few enforceable rights
Corporate concentration (the dominance of a small number of companies within a sector) can be incredibly harmful in a number of ways, including domination over prices; reduced innovation; barriers to entry; wage suppression and poor working conditions; excessive supply chain pressure; greater negative ecological and social externalities; industry collusion; greater vulnerability to system shocks; and marketing, research & lobbying advantages. Typically a concentration of four firms controlling at least 40% of the market is considered concentrated. (Gaucher-Holm et al., 2023)
Examples of different points of consolidation and control in the agrifood system. Millions of farmers around the world must buy seeds, fertilizers and chemicals from the same few firms, while selling to just a few food processors and traders who then move food further down the supply chain until it eventually winds up at retailers where a majority of us purchase our food.
Four companies (Cargill, Archer Daniels Midland, Bunge & Louis Dreyfus) control 90% of the global grain trade (Putz, 2018)
Four companies (Chem China, Corteva, Bayer & BASF) control 66% of the world’s agricultural chemicals markets (Howard & Hendrickson, 2020)
Four companies control 53% (Chem China, Corteva, Bayer & LimaGrain) of the world’s global seed market and three companies (Deer, CNH & Kubota) sell almost half of the world’s farm machinery (Clapp & Purugganan, 2020)
Six firms control 72% of the animal pharmaceutical market (ETC Group, 2022)
Ten food and beverage processing firms make 34% of sales earned by the top 100 firms and top ten retailer companies control 11% of consumer spending (IPES, 2023)
Over 70% of the world’s farmland is owned or controlled by just 1% of its farmers (Anseeuw & Baldinelli, 2020)
Four companies control 99% of the global chicken-breeding market (Agropoly 2013 but up to date)
Four firms run 75% of the world’s corporate beef packing plants & abattoirs and another four firms control 70% of corporate pork slaughter (Mooney et al., 2017).
Three companies (JBS, Marfrig, and Minerva) dominate Brazil’s beef market, accounting for over two-thirds of exports. (Barons, 2022)
JBS, Tyson, and Cargill are the world’s top meat companies, with combined annual revenues exceeding $126 billion. (Barons, 2022)
Four dairy firms control 44% of the global dairy market.
The world's largest dairy company, Nestlé, generated over $24 billion from dairy sales in 2020.
As the largest dairy company in the Middle East and Africa, Almarai controlled 44% of the dairy market in the Persian Gulf region by 2014.
The global food supply’s domination by a very horizontally and vertically industrial concentrated has made it alarmingly non-resilient:
-
Just four plants - wheat, maize, rice & soybean - account for ~60% of calories grown by farmers (D’Odorico et al., 2018)
-
Four countries sell 76% of the world’s corn (US, Argentina, Brazil & France)
-
Five countries sell 77% of the rice (Thailand, Vietnam, India, US & Pakistan)
-
Five countries supply 65% of the wheat (US, France, Canada, Russia & Australia). (D’amour & Anderson, 2020)
-
Three countries grow 86% of the world’s soybeans, which accounts for ¾ of world’s animal feed (Walton, 2019)
-
51% of the world’s crop calories are devoted to animal production (D’Odorico et al., 2018)
Meat
Four companies control 99% of the global chicken-breeding market (Agropoly 2013 but up to date)
Four firms run 75% of the world’s corporate beef packing plants & abattoirs and another four firms control 70% of corporate pork slaughter Mooney et al., 2017
Investment
Only 30% of shares in the largest agriculture and food firms are not owned by Blackrock, Vanguard, State Street and Capital Group (Clapp, 2017)

SUBSIDIES
Subsidies - government assistance that increases producers' income beyond what they would earn otherwise. Thus, they involve a transfer of wealth from taxpayers to private corporations. Subsidies help keep the prices of meat, dairy, and poultry products relatively low, making them more affordable for consumers and, theoretically, ensure the economic viability of farmers, but their distribution tends to favour large agribusinesses, intensive farming operations (subsidies are often tied to production volume) and export-oriented producers.
The top recipients are large and wealthy farms because that’s how farm subsidy programs are designed – payments are made based on acreage or production, so the farms with the most acres or most crops produced get the largest payments.
Overall Support
In 2016–18, the governments of the 79 countries for which data are available (accounting for 83% of global production) supported agricultural production and food consumption with measures that generated net transfers of $638 billion per year (Gautam et al., 2022). The true global number likely exceeds US$1 trillion and 90% cause harm to natural areas (Damania et al., 2023).
Subsidies for products such as soybeans, palm oil, and beef cause farmers to push into the forest frontier and are responsible for 14% of forest loss every year. (World Bank, 2023)
Fisheries subsidies exceed $35 billion annually and are a key driver of dwindling fish stocks, oversized fishing fleets, and falling profitability (Sumaila et al., 2018)
Figure: Composition of 2018 fisheries subsidies amount by type and grouped by a) HDI low and HDI high; and b) developed and developing country groups, for 2018 (constant USD).
-
“Beneficial” subsidies = investments in the promotion of fishery resource conservation and management
-
“Capacity-enhancing” subsidies = programs that currently, or have the potential to, encourage fishing capacity to develop to a point where resource exploitation exceeds the maximum sustainable yield
-
“Ambiguous” subsidies = potential to lead to either sustainable management or overexploitation
Survey finds that 78% of US consumers want the government to subsidize food for direct human consumption over feed for farmed animals. ~30% of US farm subsidies go to produce feed crops for dairy, eggs & meat (Elbein, 2023).
82% of EU’s agricultural subsidies (through CAP) support emission-intensive animal products (38% directly, 44% for animal feed) Kortleve et al. 2024
Current support for agriculture delivers low value for money as a way of helping farmers; for every dollar of public support, the return to farmers is just 35 cents (Gautam et al., 2022)
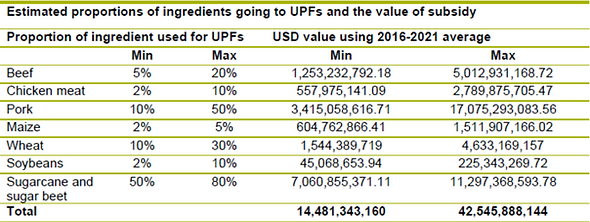
Through a combination of direct subsidies, tariffs and price controls, the world’s major agricultural producers are providing support worth up to US $42.5 billion annually for ingredients such as beef and pork, which are used to create ultra-processed foods (UPFs)
International Institute for Environment & Development (2023) & Ag Incentives
Plant- vs. Animal-Based Subsidies
Subsidies for plant-based alternatives are significantly lower compared to those for meat and dairy industries: in 2023, global public funding for alternative proteins amounted to approximately $523 million, with an all-time investment total of $1.67 billion (GFI, 2023).
In contrast, the US and EU provide around 1,000x more subsidies to meat and dairy industries than to plant-based alternatives. Between 2014 and 2020, the EU allocated about 1,200x more public funding to animal-sourced food products, and in the US, approximately 800x more public funding went to meat and dairy products compared to plant-based alternatives (Vallone et al., 2023).
45% of dairy production is subsidized by the US government (Grey, Clark, Shih and Associates, Limited, 2018).
The 2023 Farm Bill included over $30 billion in subsidies for meat and dairy, but just $50 million for plant-based alternatives (EWG).
Impact on Prices
The removal of subsidies could lead to a 10-50% increase in meat prices and a 20-50% increase in dairy prices (IIED, 2023)
If subsidies and the external costs of environmental damage were fully accounted for, the price of beef could potentially double, while the price of dairy could increase by 20-60% depending on the region and the specific environmental impacts considered (Poore and Nemecek, 2018)
Distribution & Benefits
Current support for agriculture delivers low value for money as a way of helping farmers; for every dollar of public support, the return to farmers is just 35 cents.
Repurposing ~$70 billion of distorting subsidies a year (the equivalent of 1% of global ag output) would lead to net economic benefit of over $2 trillion USD in 20 years. (Gautam et al., 2020)
Farmers in the United States own only about 55% of subsidized farmland - non-farmer landlords own the remaining 45%. If the subsidy is fully passed on to the land owners through higher rental rates, almost 43% of all farm subsidies end up in the pockets of non-farmers.
In the EU the distribution of domestic support includes 40-60% to animal production (such as breeding, fattening), 10-30% for milk and 20-30% for vegetables, fruits & nuts (Flaig and Boysen-Urban, 2019)
Repurposing Subsidies
Repurposing current agricultural subsidies to support the production of healthier and more sustainable foods could significantly increase the consumption of fruits, vegetables, and other horticultural products. In OECD countries, fruit and vegetable consumption could increase by 55 g/d (10%) on average, and in non-OECD countries by 31 g/d (5%). These changes in consumption would lead to reductions in diet-related mortality that amounted to 444,000 fewer deaths in 2030 (Springmann and Freud, 2022).
Disclosure
In the US, a change in disclosure of recipients receiving subsidies in 2019 - naming banks vs the recipients directly - makes it impossible to know how many people may be getting such payments, what they’re growing, and other key information - effectively concealing the beneficiaries of almost $3.1 billion in taxpayer dollars between 2019 and 2021.


LOBBYING
The US sector’s spending on lobbying legislation like the Farm Bill rose from $145 million in 2019 to $177 million last year (over half a billion dollars in four years), which is more than the total big oil and gas spent (Goswami and Stillerman, 2024)
Money spent by meat producers on lobbying the European Union government is three times higher than that spent by plant-based lobby groups, and 190 times higher in the US. Disproportionate spending means disproportionate access and influence. (Vallone & Lambin, 2023)
The top 10 meat and dairy companies and six largest trade associations, in the US alone, have spent over $330M just on lobbying related the environment since 2000 (Lazarus, McDermid, & Jacquet, 2021)
*Note, often times you will notice the pharmaceutical industry is one of the top global lobbyers. However, a good share of their business comes from animal agriculture, including over 70% of antibiotics.

BAILOUTS
Government bailouts for meat and dairy companies have been substantial, especially in recent years due to economic disruptions like trade wars and the COVID-19 pandemic.
U.S bailouts for animal agriculture more than doubled from $20 billion to over $50 billion in 2020, largely due to the COVID-19 pandemic and trade wars. Specific examples include $1.2 billion for pig farmers and $3.5 billion for dairy producers. In stark contrast, plant-based milk producers and oat farmers received only $44 million (Essig, 2022)
2020 Farm Policy Encouraged Livestock Production | Source: Spence, 2021
In the U.S., the Trump administration significantly increased support for the agriculture sector, including meat and dairy, during the trade wars and the COVID-19 pandemic. In 2020 alone, subsidies and bailouts for these industries more than doubled to over $50 billion, (Luiz, 2022)
The USDA has historically implemented various programs to support the dairy industry, including the purchase of surplus products and financial assistance to manage price volatility.
For example, during the trade war with China, the USDA provided up to $12 billion in financial aid to affected agricultural producers, with significant portions allocated to meat and dairy farmers (Nankin et al., 2009)

TRADE
Although only 17% of all food by weight is currently traded across borders, it accounts for nearly 80% of calories in certain regions. And the value of trade has grown 8x over the past five decades, during which production has tripled. Staple grains, mostly for animal feed, dominate this trade. (Laderchi et al., 2024)
Almost 20% of global calories consumed are provided by trade. (Manduna, 2024)
Globally, an estimated 37% of harvested major crops is used for domestic food crops - the remainder goes to exports, processing, industry or other uses. (Laderchi et al., 2024)
Source: FAO, 2022
International meat trade will expand in response to growing demand from countries in Asia and the Near East, where production will remain largely insufficient to meet demand. Import demand in several middle and high income Asian countries has been steadily increasing in recent years due to a shift toward diets that include higher quantities of animal products. International trade agreements have included specific provisions for meat products that improve market access and create trade opportunities. OECD-FAO (2021)
Exports
The Cairns Group (19 countries) together account for more than 27% of the world’s agricultural exports (IATP).
Brazil, the U.S., and the EU dominate the global export of animal products, particularly beef, pork, and chicken, accounting for more than 60% of global meat trade (OECD-FAO, 2021)
Imports
40% of the world's population depends on imported food, particularly in regions like Sub-Saharan Africa and the Middle East, making these areas vulnerable to global trade disruptions and price volatility (World Bank, 2023).
